P-Hacking — Part 01: Introduction / What is p value?
Each & every day we see news on television or on the internet about new scientific discoveries. A lot if these start with “A new study shows…”. Some of these start with “Psychology says…” I bet you should have seen a lot of them on social media. Here are some examples.


Have you ever taken a moment to think where could these experiments could be coming from? Who are these scientists? Are the legit? Can we really depend and make decisions on these findings? Questioning whatever provided to you to believe is common among intelligent people and it actually helps you to stay out of unnecessary trouble. One thing we all must keep in mind is that science does not lie.
How can we be so sure about these studies?
There are quite number of ways to check the validity of the stuff you see on television or on the internet. Running an image search on google, checking the reputation of the publisher, checking on the internet whether the content is true, are some of them. There’s a lot of things which you need to be careful before using, reposting or spreading what you see or hear in day to day life. I’m hoping to write a separate article on that and once I finish I’ll leave a link here. But in this article lets focus on how these study results are manipulated and mislead.
Talking about the ways of manipulating the results, one way is to redo the experiments again and again for a large number of times until you get the results you want and not mentioning about the unsuccessful attempts resulted in the process. This is unacceptable because you might do the same test for several times and get the results to prove your hypothesis once and only publish about the one time you succeeded and not the failed! Because most of the times there may not be an actual connection if the reproducibility is that low. This is called as the “file drawer effect.”
Let’s say that a research group intends to prove that there’s a relationship between wearing glasses indicates that you’re smarter! So, they design and conduct an experiment, but they fail to get the expected results. So they keep doing the same experiment again and again with no satisfying result
But on the 25th time, they get what they want and publishes there achievement. But they intentionally cover up about the 24 other times
they conducted that same study and failed.Another method is P-Hacking.
P-Hacking
P value

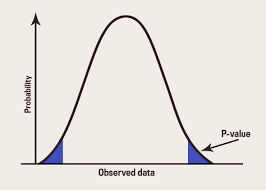
In simple terms P-value is a measure of the strength of the evidence against the null hypothesis that is provided by our sample (Null Hypothesis — which is the idea that there’s no effect). In other words p-value is the probability of getting the observed value of the test statistic, or a value with even greater evidence against the null hypothesis if the null hypothesis is actually true.
The use of p-values in statistical hypothesis testing is common in many fields of research such as physics, economics, finance, political science, psychology, biology, criminal justice, criminology, and sociology
The null hypothesis is rejected if any of these probabilities are less than or equal to a small fixed but arbitrarily predefined threshold value α, which is referred to as the level of significance. Unlike the p-value, the α level is not derived from any observational data and does not depend on the underlying hypothesis; the value of α is instead set by the researcher before examining the data. The setting of α is arbitrary. By convention, α is commonly set to 0.05, 0.01, 0.005, or 0.001. (Source — Wikipedia)
The p-value is the probability that you would get the observed results (or something more extreme) if there is no real difference between groups. It ranges from 0–1, and the general rule seems to be that the lower the P value, the better chance of proving the null hypothesis is false. Hypothetically, getting a P Value of 1 would mean the results are definitely based on something other than what you’re testing. A P Value of 0 would be the results are definitely based on what you’re testing.
History

Computations of p-values date back to the 1700s, where they were computed to calculate the ratio of male and female births. The p-value was first formally introduced by English Mathematician Karl Pearson. In his chi-squared test and In 1914, he published his Tables for Statisticians & Biometricians. For each distribution, Pearson gave the value of P for a series of values of the random variable.
Later use of the p-value in statistics was popularized by Ronald Fisher, and it played a central role in his approach to the subject. In his influential book “Statistical Methods for Research Workers” (1925) he included tables that gave the value of the random variable for specially selected values of P. The book was a major influence throughout the 1950s. Fisher proposed the level p = 0.05, or a 1 in 20 chance of being exceeded by chance, as a limit for statistical significance. The same approach was taken for Fisher’s “Statistical Tables for Biological, Agricultural, and Medical Research” published in 1938 with Frank Yates. Even today, Fisher’s tables are widely reproduced in standard statistical texts. Fisher emphasizes that while fixed levels such as 5%, 2%, and 1% are convenient the exact p-value can be used and the strength of evidence can and will be revised with further experimentation.
Although Fishers work was influential his tables were compact where Pearson described the distribution in detail. The impact of Fisher’s tables was profound. Through the 1960s, it was standard practice in many fields to report summaries with one star attached to indicate P≤0.05 and two stars to indicate P≤0.01, Occasionally, three starts were used to indicate P≤0.001.
Still, why should the value 0.05 be adopted as the universally accepted value for statistical significance? Why has this approach to hypothesis testing not been supplanted in the intervening three-quarters of a century?
Why do we use 0.05 as the standard P value? There are many theories and stories to account for the use of P=0.05 to denote statistical significance. Does it have scientific evidence in the present to back this value?
The standard level of significance used to justify a claim of a statistically significant effect is 0.05. For better or worse, the term statistically significant has become synonymous with P ≤ 0.05. I say it is because of the influence of Fishers work. In the page 44 of the 13th edition of his book, describing the standard normal distribution he states that,
The value for which P=0.05, or 1 in 20, is 1.96 or nearly 2; it is convenient to take this point as a limit in judging whether a deviation ought to be considered significant or not. Deviations exceeding twice the standard deviation are thus formally regarded as significant. Using this criterion we should be led to follow up a false indication only once in 22 trials, even if the statistics were the only guide available. Small effects will still escape notice if the data are insufficiently numerous to bring them out, but no lowering of the standard of significance would meet this difficulty.
Continue to read about the problem with the P value and why scientists are forced to p-hack, in the next article.
